Measuring the Carbon Footprint of Green Your Future
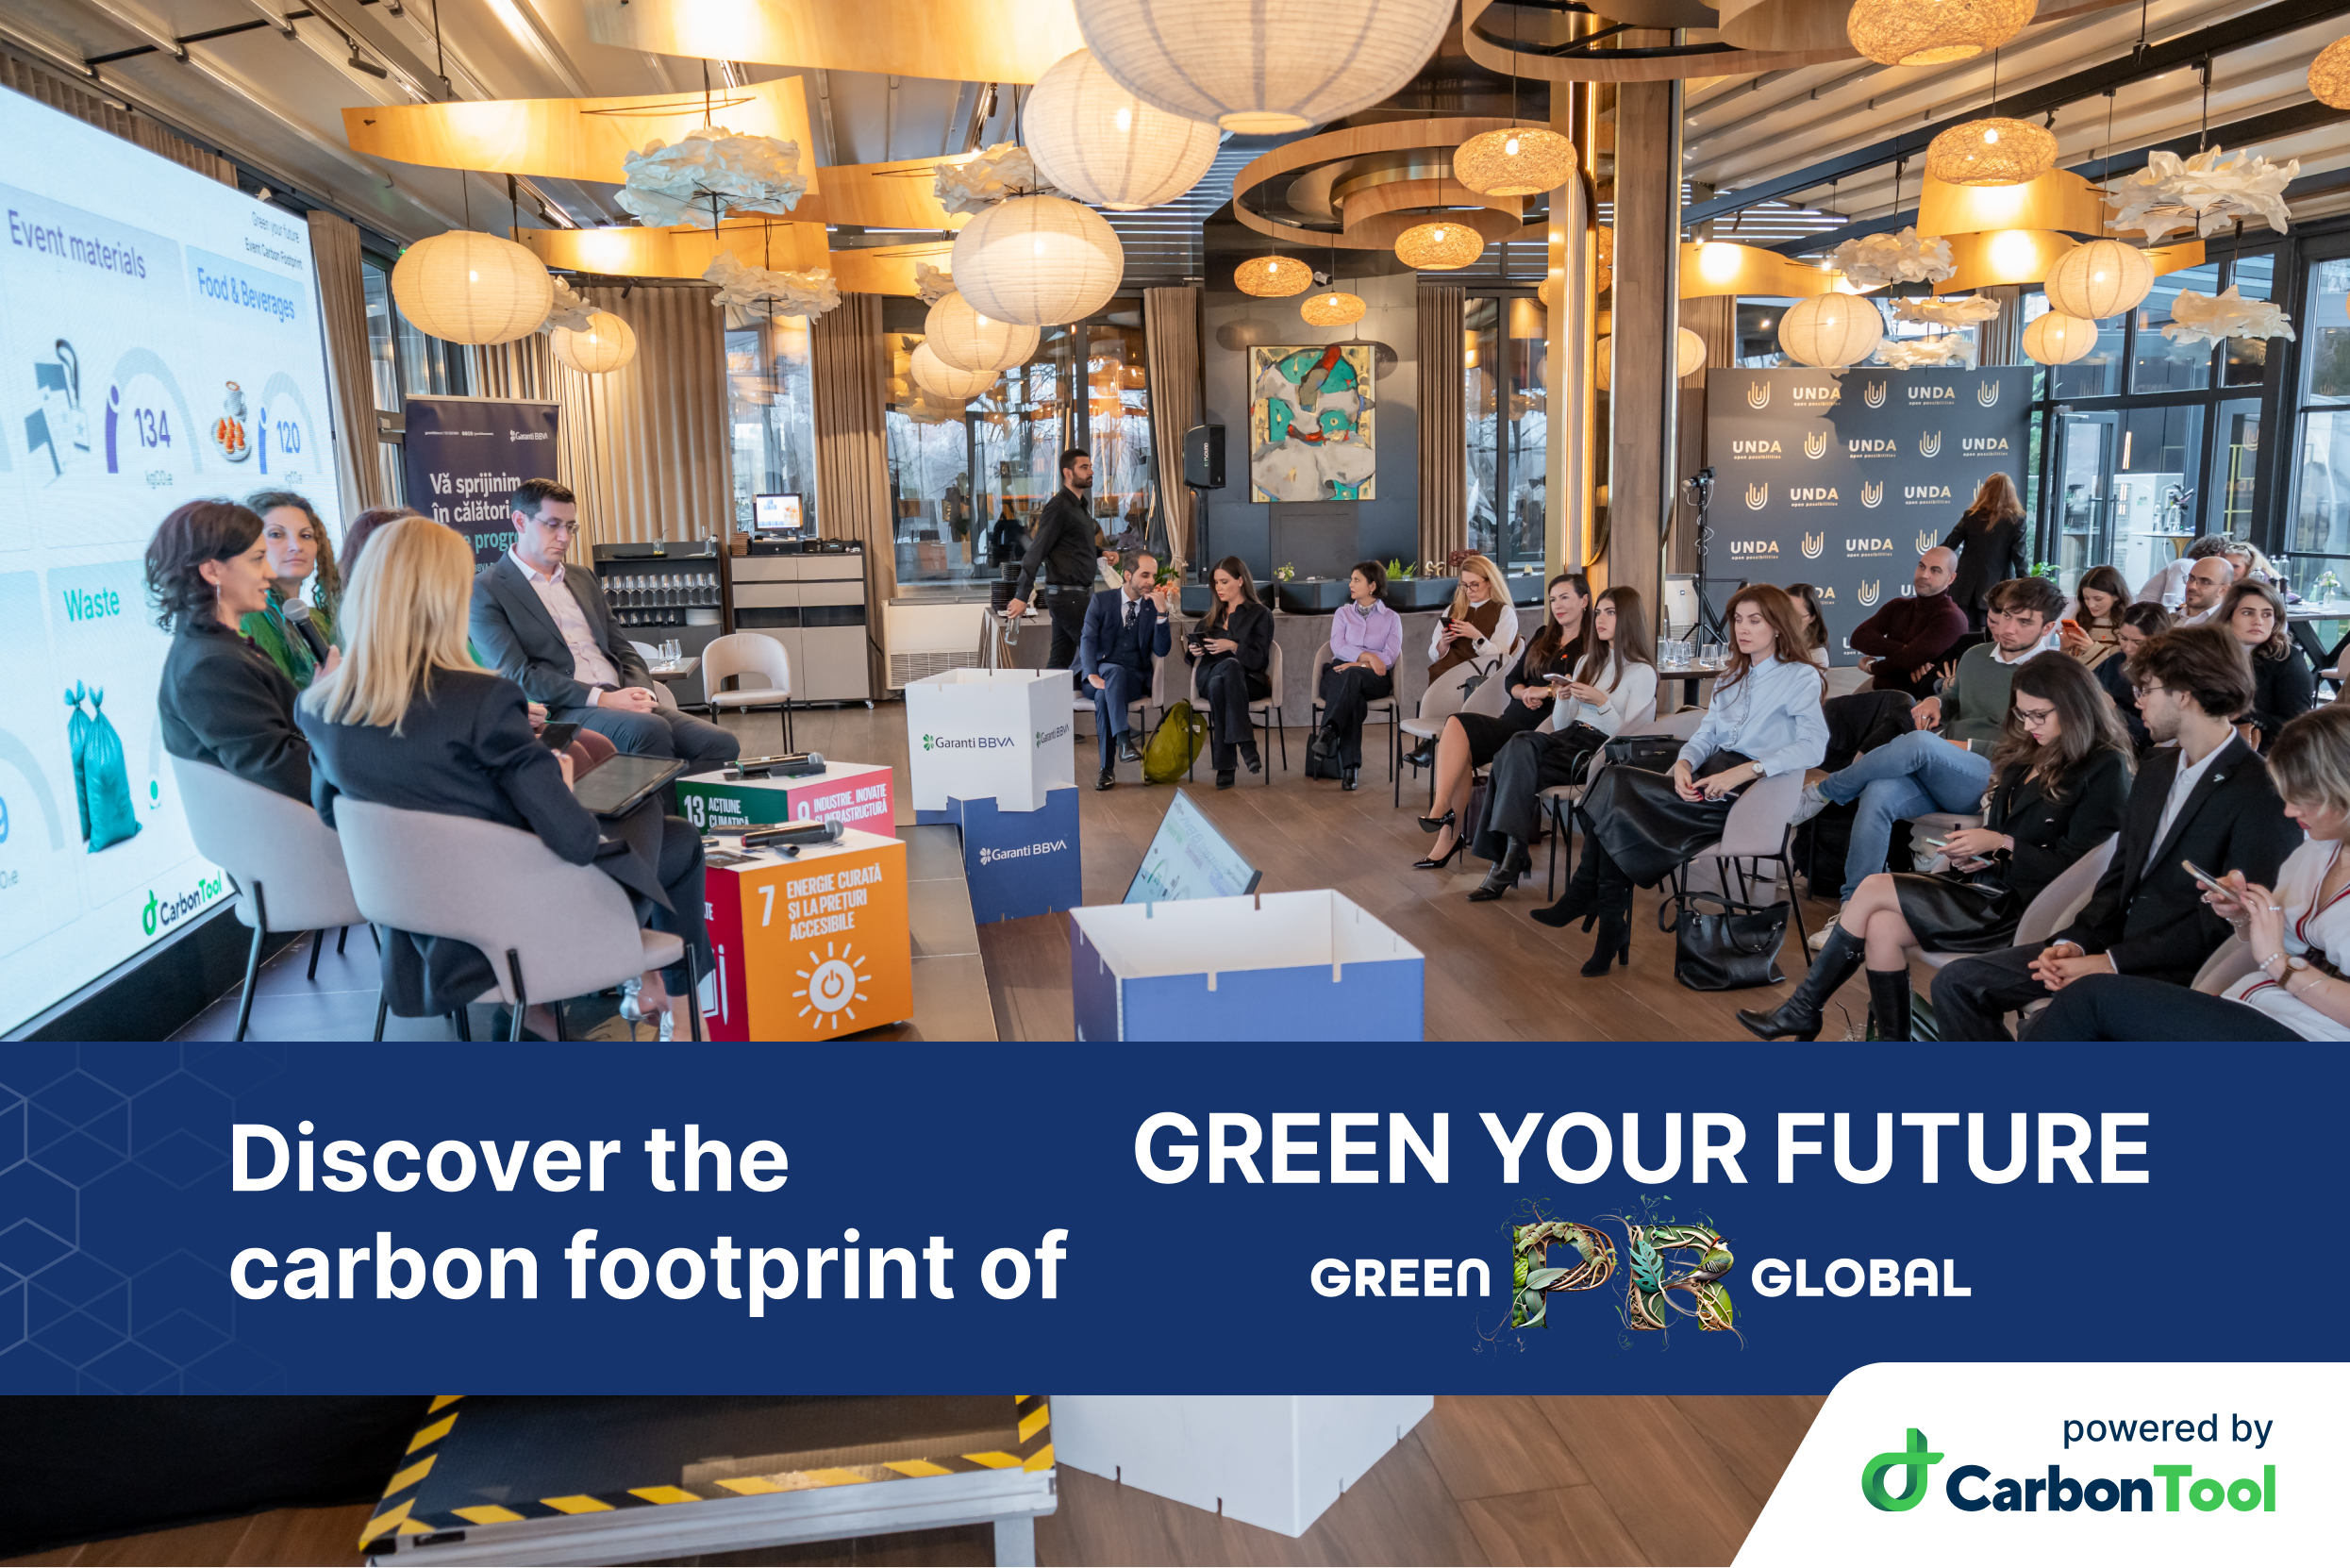
At CarbonTool, we believe that sustainability commitments become truly meaningful when they are measured. That’s why we were glad to support Green Your Future – 4th Edition, an event organized by Green PR Global, by calculating and transparently communicating its carbon footprint.
The event brought together professionals, companies, and students to discuss how sustainability is shaping the future of business and society, while also offering a practical example of how environmental impact can be tracked in real time.
A More Interactive, Data-Driven Experience
Throughout the event, participants were invited to scan a QR code and input their commuting choices. This information fed directly into CarbonTool’s live dashboard, allowing attendees to see how their individual travel decisions influenced the overall carbon footprint of the event.
This approach ensured that commuting emissions were calculated based on real participant data, rather than assumptions, and helped raise awareness around the impact of everyday mobility choices.
What Was the Event’s Carbon Footprint?

The total carbon footprint of Green Your Future – 4th Edition was: 1,483 kgCO₂e
This footprint covers all major event-related activity categories, with the following breakdown:
- Participant commuting: 683 kgCO₂e (46.06%)
- Organizers’ work: 322 kgCO₂e (21.71%)
- Food & beverages: 300 kgCO₂e (20.23%)
- Event materials: 134 kgCO₂e (9.04%)
- Waste: 33 kgCO₂e (2.23%)
- Electricity: 11 kgCO₂e (0.74%)
As with many professional events, participant commuting represented the largest share of emissions, reinforcing how mobility choices strongly influence an event’s environmental impact.
Insights from Participant Commuting Data

The live data collected during the event revealed the following distribution of travel modes:
- Car travel: 72.7%
- Walking: 13.6%
- Bus: 9.1%
- Rail-based public transport: 4.5%
- Air travel: 4.5%
- Biking: 0%
While private car use remained dominant, the presence of walking and public transport highlights both accessibility and growing awareness around lower-impact mobility options. At the same time, the absence of cycling participation offers a clear opportunity for future improvement, especially relevant given the event’s long-term sustainability goals.
Making the Numbers Tangible: Real-World Equivalences
One of the goals of Green Your Future is to actively promote sustainable mobility, including the ambition to help develop 100 km of bicycle lanes in Bucharest. In this context, CarbonTool translated the total carbon footprint into intuitive, real-world equivalents to make the impact easier to understand:
The total footprint of 1,483 kgCO₂e is equivalent to:
- 9,887 km driven by a diesel car
- 12.36 bicycles produced
- 395.47 bicycle helmets manufactured
- 988.67 reusable bottles produced
Looking Ahead
By combining dialogue, education, and transparent data, Green Your Future – 4th Edition demonstrated how sustainability conversations can be grounded in measurable impact. Understanding where emissions come from is the first step toward reducing them, whether through improved mobility planning, material choices, or participant engagement.
At CarbonTool, we’re glad to support events that move beyond intentions and into action, using data to inform smarter, more responsible decisions.
Sustainability isn’t just discussed. It’s measured.
Gain Sustainability Insights
Stay informed
Press releases and company announcements delivered directly to your inbox. No marketing emails.
Ready to turn carbon data
Join the companies using CarbonTool to measure emissions, manage risk, and report with confidence. Start free. No credit card, no sales call.